|
Sao Mai Group Corporation
|
|
|
|
Sector:
Manufacturing
|
|
Industry:
Food Manufacturing
|
|
7,930 
-90 (-1.12%)
03/28 08:05
End trading
|
|
Open
|
8,000
|
|
High
|
8,050
|
|
Low
|
7,930
|
|
Vol
|
524,700
|
|
Market Cap.
|
2,936
|
|
|
Remain Bid
|
52,500
|
|
Remain Ask
|
28,600
|
|
52Wk High
|
12,100
|
|
52Wk Low
|
7,900
|
|
52Wk Avg Vol
|
1,506,251
|
|
|
Foreign Buy
|
200
|
|
Frgn Owned(%)
|
12.32
|
|
Dividend
|
0
|
|
Dividend Yield |
0.00
|
|
Beta
|
0.94
|
|
|
EPS
|
518
|
|
P/E
|
15.48
|
|
F P/E
|
3.71
|
|
BVPS
|
21,827
|
|
P/B
|
0.36
|
|
|
|
|
|
1
day
| 5
days
| 3
months
| 6
months
| 12
months
|
|
|
| |
|
|
|
|
|
History price
|
 |
| Date | Price | Change | Volume | Avg. Buy | Avg. Sell | Foreign Buy | Foreign Sell |
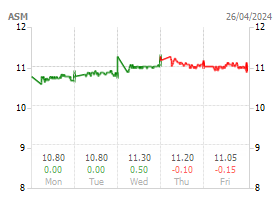
| 28/03/25 |
7,930 |
-90 ▼(-1.12%)
| 524,700 | 1,668.21 | 1,969.04 | 200 | 8,200 |
| 27/03/25 |
8,020 |
+70 ▲(0.88%)
| 1,233,100 | 2,204.96 | 3,828.92 | 54 | 3,500 |
| 26/03/25 |
7,950 |
-80 ▼(-1.00%)
| 801,700 | 1,660.64 | 4,002.25 | 4,700 | 4,700 |
| 25/03/25 |
8,030 |
-20 ▼(-0.25%)
| 626,500 | 2,265.7 | 3,829.09 | - | - |
| 24/03/25 |
8,050 |
-10 ▼(-0.12%)
| 602,600 | 1,907.63 | 3,016.52 | - | 16,300 |
|
|
|
Financials
|
|
|
|
|
|
|
|
|
Industry Peers |
|
|
|
|
|
Symbol
|
Price
|
Vol
|
P/E
|
P/B
|
Mkt Cap
|
|
VNM
|
|
60,300 (-1.31%)
|
|
5,430,100
|
|
13.60
|
|
3.48
|
|
126,024
|
|
MSN
|
|
68,500 (-1.30%)
|
|
3,797,400
|
|
49.82
|
|
2.42
|
|
98,527
|
|
KDC
|
|
56,000 (-0.53%)
|
|
368,600
|
|
433.08
|
|
2.27
|
|
16,229
|
|
VHC
|
|
62,000 (-3.13%)
|
|
1,160,800
|
|
11.63
|
|
1.55
|
|
13,916
|
|
SBT
|
|
14,850 (0.00%)
|
|
2,427,300
|
|
13.92
|
|
1.04
|
|
12,096
|
|
|
News
|
|
|
|
|
|
Download documents
|
|
|
|
|
|
Overview
|
|
|
Contact
|
Listing Inf.
|
Business Reg.
|
Additional Inf.
|
Events
|
Notes
|
|
|
|
Exchange
|
HoSE |
|
Sector
|
Manufacturing |
|
Industry
|
Food Manufacturing |
|
Listing date
|
01/18/2010 |
|
Chartered capital
|
3,701,782,500,000 |
|
Shares listed
|
370,178,250 |
|
Shares outstanding
|
370,178,250
|
|
Status
|
Operating |
|
Tax code
|
1600169024 |
|
Establishment License
|
0450/GP/TLDN-03 |
|
Issued date
|
03/05/1997 |
|
Business license
|
064828 |
|
Issued date
|
03/15/1997 |
|
Main business scope
|
- Constructing industrial and civil work, transport and irrigation works. - Producing and trading construction materials. - Trading real estate. - Exporting seafoods. - Other businesses under the business lisence. |
|
|
|
|
- 05 February 1997: Sao Mai An Giang Construction and Investment Joint Stock Company was established under the Decision No.000450/GP/TLDN-03 issued by An Giang Provincial People's Committee; - 05 March 1997: Came into operation with an initial charter capital of VND905 million under the business registration certificate No.064828 issued by An Giang Department of Planning and Investment; - 2009: Charter capital was raised to VND99,126,000,000; - 2010: Listed and traded on Hochiminh Stock Exchange (HOSE); - 2013: Charter capital was raised to VND476,834,400,000; - 2014: Renamed as Sao Mai Group Corporation with a charter capital raised up to VND1,072,877,400,000; - 2015: Charter capital was raised to VND2,199,398,670,000; - 27 October 2017: Charter capital was raised to VND2,419,338,530,000; - 04 May 2019: Charter capital was raised to VND2,588,678,490,000; |
 22/08/2024 09:00
|
|
ASM Annoucement of the change of listing - 33,651,498 shares
|
|
Location
: Securities Companies
|
|
|
12/08/2024 09:00
|
|
ASM Decision on the change of listing - 33,651,498 shares
|
|
Location
: Securities Companies
|
|
|
15/07/2024 09:00
|
|
ASM Dividend payment by share with 10.00% for 2023 (Record date)
|
|
Location
: Securities Companies
|
|
|
Items
|
Unit
|
|
Price |
VND
|
|
Volume |
Shares
|
|
Foreigner's, Yield |
% |
|
Mkt Cap |
bVND
|
|
Financial indicators |
mVND |
|
EPS, BVPS, Dividend |
VND
|
|
P/E, F P/E, P/B
|
Times
|
|
ROS, ROA, ROE |
%
|
1. The accounting period for equitization year was calculated as of company's establishment date.
2. F PE bases on corporate earnings targets, which are announced by listed companies.
3. 3-month/6-month/12-month price charts was was compiled from revised data.
|
|
|
|
|
|
|
|